Module 16: Methods for applying health economics to healthcare decisions
Components of a health economic evaluation
Every economic evaluation, from a simple cost analysis to a full cost-utility model, is built from the same parts. Before any numbers are calculated, the analyst needs to settle who the evaluation is about, what is being compared, which costs and outcomes count, from whose point of view and for how long. Health technology assessment bodies often set these out in a "scope" using the PICO framework: Population, Intervention, Comparator and Outcomes. Getting them right matters more than any modelling technique. A sophisticated model built on the wrong population or the wrong comparator will answer the wrong question very precisely.
Population
The population is the group of people whose treatment depends on the decision. It should be defined as precisely as the evidence allows: the condition, its severity, age range, previous treatment, and any other features that affect who would receive the intervention in practice. That definition matters because it sets the baseline risk. A service that prevents admissions can only do so in people who would otherwise have been admitted. The population also has a size, which matters in its own right. Budget impact analysis needs to know how many people are eligible and how many will take up the intervention each year.
Comparator
The comparator is the option the intervention is compared with. It should reflect what would actually happen if the intervention were not adopted. That is usually current standard care, not "doing nothing", and there may be more than one realistic alternative. Comparing a new service with an option nobody would choose makes almost anything look good.
Costs
In economic evaluation, a cost is not simply the price on an invoice. It is the value of the resources an intervention uses, which could have been used for something else. Staff time, equipment, consumables, drugs, buildings, IT, training and overheads all count, whether or not new money is spent. Costs are estimated in three steps: identify the resources used, measure how much of each is used, and value each at a unit cost from a stated source, such as the PSSRU Unit Costs of Health and Social Care, the National Cost Collection or the British National Formulary, with the price year given. Section 1.5 works through these steps in detail. Costs include those of the intervention itself and its knock-on effects on other services, which can go down as well as up.
Perspective and time horizon
The perspective decides whose costs and outcomes count. Who is the decision maker, and what costs/outcomes do they care about? NICE's reference case uses the perspective of the NHS and personal social services: only costs that fall on those budgets are included, and outcomes are the health effects on patients (and carers, where relevant). A societal perspective is wider. It also counts patients' own spending (travel, prescriptions, home adaptations), time off work, and unpaid care by family and friends. The choice can change the result. A service that moves care from hospital to home may save the NHS money while moving costs onto patients and carers. Whatever perspective is used, it should be stated at the outset and applied to costs and outcomes alike. Budget impact analysis uses a narrower perspective again: the specific budget holder making the decision.
The time horizon is how long the evaluation follows costs and outcomes. NICE asks for a horizon long enough to capture all important differences between the options. For long-term conditions, that often means a lifetime. The choice can transform the answer, because costs usually come early and benefits build up later. The horizon should be chosen for clinical reasons and justified in advance, not picked to suit the result. Over any horizon longer than a year, future costs and outcomes are discounted to their value today.
Health outcomes
Health outcomes are the changes an intervention makes to people's health. They range from clinical measures (lung function, blood pressure, exacerbation rates) to final outcomes that patients and the health system care about directly: deaths avoided, life-years gained and quality of life. An important distinction is between intermediate and final outcomes. Intermediate outcomes, such as oxygen readings or how often patients use an app, are quicker and cheaper to measure. But they only show value if there is good evidence that they lead to a final outcome. A digital service with excellent engagement and no effect on admissions or quality of life has not yet shown any value.
The most widely used ‘generic health outcome’ in health economics is the quality-adjusted life year (QALY). It combines length and quality of life in one number:
QALYs = years lived × quality of life weight
Quality of life weights (also called utilities) are scored on a scale where 1 is full health and 0 is a state judged as bad as being dead. Some very severe states score below zero. One year in full health is 1 QALY. One year at a weight of 0.5 is 0.5 QALYs, and so are six months in full health. The weights usually come from the EQ-5D questionnaire. Patients describe their health on five dimensions: mobility, self-care, usual activities, pain or discomfort, and anxiety or depression.
Healthcare resource use outcomes
HCRU outcomes count how much health and care services people use: hospital admissions, bed days, A&E attendances, GP and nurse appointments, outpatient visits, prescriptions, tests and social care. They are often the outcomes commissioners care most about, because they link directly to capacity and spending.
HCRU outcomes play two roles. Counted in natural units, they are outcomes in their own right, as in "cost per admission avoided" or a row in a cost-consequence table. Multiplied by unit costs, they become part of the costs of each option. This dual role is useful, but it has a trap. An avoided admission can be counted as a health benefit or as a cost saving, but not both at once in the same total. It is also worth remembering that resource use is not health. Fewer GP visits can mean that patients are better, or that they have stopped seeking care they need. HCRU outcomes should be read alongside general health outcomes, not instead of them.
Methods in Economic Evaluation
Health Economics uses a number of analytical methods to compare the resources invested against outcomes achieved. These methods differ in how they quantify and monetise health benefits and the availability of data. Main Economic evaluation approaches can be classified into partial economic evaluation and full economic evaluation. The dividing line is set by two simple tests:
Does the study look at both costs and outcomes?
Does it compare two or more options?
A study is a full economic evaluation only if the answer to both questions is yes. If either answer is no, it is a partial evaluation.
|
|
|
|---|---|---|
|
|
|
|
|
|
Table 1: The two tests that separate partial from full economic evaluation.
It should be noted that a study that measures both costs and outcomes of the intervention with nothing to compare to is still a partial evaluation. In this case, you learn what the intervention costs and outcomes it achieves but not whether it is better value than the alternative, because there is no comparison.
Partial evaluations are not second-class. They answer different, and often perfectly legitimate, questions: "how much does COPD cost us?", "what does it cost to run this pathway?", "can we afford this next year?". They also supply the building blocks (unit costs, resource use, disease burden, baseline event rates) that every full evaluation depends on. What they cannot do is show relative value for money, and so on their own they will not support a recommendation from a health technology assessment (HTA) body such as NICE. Partial evaluations tend to be used in three situations:
The question does not need a comparison. Sizing a problem, or pricing a service, is a legitimate goal in itself.
The evidence is not yet mature. An early-stage product may have cost data but no reliable outcome data, or no clear comparator.
The decision-maker's question is about money, not value. Finance teams often need to know about cash flow and affordability, whatever the value for money.
Full evaluations comprise cost-consequence, cost-minimisation, cost-effectiveness, cost-utility and cost-benefit analysis. They differ in one main way: how they measure and combine the outcomes.
Supporting analyses. Two widely used methods do not sit neatly in either box. Budget impact analysis compares options and covers both costs and some outcomes, but it asks "can we afford it?", not "is it good value?". It does not weigh costs against health gains. Return on investment asks "does it pay back in cash?". It counts outcomes only if they can be turned into money. Both are best thought of as supporting analyses: essential companions to a full evaluation, but not substitutes for one. (You will see budget impact analysis placed in different boxes by different textbooks. What matters is being clear about the question it answers.)
| Method | Group | How outcomes are measured | Question answered |
|---|---|---|---|
| Costing analysis | Partial | Not measured | What does it cost to deliver? |
| Cost of illness | Partial | Not measured (or described) | How big is the problem? |
| Budget impact analysis | Supporting | Resource use, in cash per year | Can we afford it? |
| Return on investment | Supporting | Cash savings only | Does it pay back? |
| Cost-consequence analysis | Full | Many outcomes, listed side by side | What are all the effects? |
| Cost-minimisation analysis | Full | Assumed (and shown) to be equal | Which is cheaper? |
| Cost-effectiveness analysis | Full | One natural unit (e.g. admissions avoided) | What does each unit of effect cost? |
| Cost-utility analysis | Full | QALYs | What does each QALY cost? |
| Cost-benefit analysis | Full | Money | Do the benefits exceed the costs? |
Return on investment
The question
For every pound we put in, how many pounds come back?
How it is done
Return on investment (ROI) is a financial measure borrowed from business. In its simplest form:
ROI = (financial benefits − investment) ÷ investment
An ROI of 0.5 (or 50%) means every £1 invested returns £1.50 in total, a net gain of 50p. An ROI of zero means the investment exactly pays for itself. A negative ROI means it does not pay for itself in cash. Some reports instead give a "return per £1", the total benefit divided by the investment. Check which version is being used: a "£1.50 return per £1" and an "ROI of 50%" describe the same result.
ROI is popular with commissioners and finance directors because it speaks their language. It has been widely used in public health, where national bodies have published ROI tools to help local authorities choose prevention programmes.
In health economic terms, ROI is a narrow form of cost-benefit analysis in which only cash benefits count. Health gains are ignored unless they can be converted to money.
Common mistakes in ROI Mixing cashable and non-cashable savings. Only cash that actually leaves a budget counts as a cash return. Released time, freed beds and avoided activity are benefits, but not cash, unless something is cut. Choosing the time horizon to suit the answer. Prevention programmes look poor over one year and good over twenty. Always report the time horizon next to the ROI, and test more than one. Leaving out who pays and who gains. A service funded by a local authority may save money for the NHS. The overall ROI can be positive while the funder loses. Split the ROI by budget holder when this matters. Using ROI as the only measure of value. ROI ignores health. For health services, it should always sit alongside a cost-utility or cost-consequence analysis. |
Costing analysis
The question
What does it cost to deliver this service or treatment?
Every other method in this chapter rests on getting this right. If the costs are wrong, the budget impact, the return on investment and the cost per QALY are all wrong too.
How it is done
Costing follows three steps, often summarised as identify, measure, value:
1. Identify every resource the service uses: staff time, equipment, consumables, drugs, tests, buildings, IT, training, management and overheads.
2. Measure how much of each resource is used, per patient or per year.
3. Value each resource at a unit cost, such as a cost per hour of nurse time or per test.
There are two broad approaches.
Micro-costing ("bottom-up"). Each resource item is counted and priced separately. This is slow but accurate, and it is the only option for new services that do not yet have a national price. Most digital health technologies fall into this group.
Gross costing ("top-down"). An average cost per episode is used, for example the national average cost of a COPD admission from the National Cost Collection. This is quick but hides variation. A frail 85-year-old with pneumonia and a 60-year-old admitted overnight both count as "one admission".
In the UK, the standard sources of unit costs are the Unit Costs of Health and Social Care (published annually by the Personal Social Services Research Unit, PSSRU), the National Cost Collection for NHS hospital activity, and the British National Formulary (BNF) or Drug Tariff for medicines. Always state the source and the price year.
The Pitfalls
Common mistakes in costing Confusing price with cost. An NHS tariff or a list price is what someone pays, not the value of the resources used. A national tariff can be well above or below the true local cost. Counting "released time" as cash. If the intervention saves 2,000 hours of GP time a year, that is only a cash saving if a GP post is cut or locum spending falls. If the time is used to see other patients, the benefit is real, but it is extra activity, not money back in the budget. Value cases that add up "hours saved × hourly rate" and call the total a saving are the single most common overclaim in digital health. Leaving out overheads and set-up costs. Training, IT integration, information governance, project management and clinical safety work are real costs. They are often left out because they fall on a different budget. Ignoring capacity. A cost per patient is only meaningful at a stated level of use. Always say what caseload the cost assumes. |
Cost of illness/burden of disease
The question: How much does this condition cost us, or society?
How it is done: A cost of illness study adds up the resources used because of a disease. There are two main designs.
• Prevalence-based: all the costs of everyone with the disease in one year. This is useful for budgets and planning. ("COPD costs our ICB £X this year.")
• Incidence-based: the lifetime costs of the new cases that start in a year. This is useful for judging prevention. ("Each new case we prevent saves £Y over its lifetime.")
Costs are usually grouped into three types:
• Direct costs: NHS and social care resources, such as GP visits, drugs, admissions and care home places.
• Indirect (productivity) costs: time off work, early retirement, unpaid care by family members.
• Intangible costs: pain, distress and lost quality of life. These are rarely given a money value in a cost of illness study, but they should at least be described.
What cost of illness can and cannot tell you
A cost of illness study is useful for showing that a problem matters and for setting priorities for research and service development. It tells you where the money is going. What it cannot tell you is whether any particular intervention is worth funding. A disease that costs £8 million a year in healthcare resource use is a problem, but an intervention targeting the disease would only ever affect part of that cost, and it costs money to run. Knowing the size of the burden says nothing about whether your intervention can alleviate the cost, or at what price.
Common mistake: treating burden as proof of value A pitch deck that opens with "COPD costs the NHS billions of pounds a year" and then presents a product is borrowing credibility from the size of the problem. The size of the burden is not evidence that the product works, or that it is good value. Always ask: "How much of this burden does this intervention actually change, and what does that cost?" A second, subtler trap is double counting. If you add productivity losses to NHS costs, check that the same event is not counted twice (for example, counting both an admission and the wages lost during the same admission as separate "savings" in a later ROI). |
Cost consequences analysis
The question
What are all the costs and all the effects of each option, side by side?
How it is done
A cost-consequence analysis (CCA) sets out the costs of each option and a range of outcomes in a single table, without combining them into one number. The outcomes can be in any units: clinical measures, events avoided, patient experience, staff workload, waiting times. The decision-maker then weighs them up.
Where you will see cost-consequence analysis NICE uses cost-consequence approaches in several places, including parts of its public health and social care work and some of its evaluations of medical technologies, where the main question is often whether a device saves money compared with current practice. For digital health, a CCA is often the most honest first analysis: it shows what is known and what is not, before a full cost-utility model is justified. |
Common mistakes in cost-consequence analysis Listing only good news. Include outcomes that go the wrong way (staff workload, false alarms, patients who cannot use the technology). Adding up outcomes that overlap. "Admissions avoided" and "bed days saved" are largely the same benefit. Listing both is fine. Adding their values together is double counting. Mixing time horizons. Costs over five years next to outcomes over six months is misleading. Use the same horizon for all rows, or label each clearly. |
Cost minimisation analysis
The question
If two options produce the same outcomes, which is cheaper?
How it is done
Cost-minimisation analysis (CMA) is the simplest full evaluation. If you can show that two options have the same outcomes, you only need to compare their costs. The cheaper one wins.
The whole method rests on one condition: the outcomes really must be the same. And this is where CMA usually goes wrong.
Where cost-minimisation is appropriate CMA is still the right tool when equivalence is clear on good grounds. Common examples include:
NICE offers a cost-comparison route for some technology appraisals, where a company can show that its technology is likely to give similar or greater health benefits at similar or lower cost than a technology NICE has already recommended for the same use. This is a formal version of the same logic, with the evidence for similar benefit examined by an independent committee. |
Common mistakes in cost-minimisation analysis Treating "no significant difference" as "no difference". Always look at the confidence interval, not just the p-value. Ignoring differences in side effects, convenience or patient experience. Two drugs with the same effect on blood pressure are not "the same" if one causes a troublesome cough. Comparing costs over too short a period. A cheaper device that fails sooner may cost more over its life. |
Cost effectiveness analysis and cost utility analysis
These two methods are closely related, and most of the ideas are shared, so they are covered together. Cost-utility analysis is really a special case of cost-effectiveness analysis in which the outcome is always a quality-adjusted life year (QALY). In the UK, "cost-effectiveness analysis" is often used loosely to mean both.
The question
Cost-effectiveness analysis (CEA): What does each extra unit of a single health outcome cost?
Cost-utility analysis (CUA): What does each extra quality-adjusted life year cost?
The key idea: think in increments
Economic evaluation is always about the difference between options. The question is not "what does the intervention cost per health effect?" but "what does the intervention cost compared with the alternative, and what does it achieve compared with the alternative?". The central summary is the incremental cost-effectiveness ratio (ICER):
ICER = (cost of new option − cost of comparator) ÷ (effect of new option − effect of comparator)
The ICER tells you the extra cost of buying one extra unit of effect by switching from the comparator to the new option.
Why averages mislead Suppose option A costs £10,000 and gives 5 QALYs (£2,000 per QALY on average), and option B costs £30,000 and gives 6 QALYs (£5,000 per QALY on average). The averages make B look only moderately more expensive. But moving from A to B costs £20,000 extra for just 1 extra QALY: an ICER of £25,000 per QALY. Decisions are about the change, so the ICER, not the average, is the right figure. |
The cost-effectiveness plane
The plane (Figure 1.3) is the simplest way to picture a comparison. The horizontal axis shows the extra health gained. The vertical axis shows the extra cost. Every result falls into one of four quarters:
South-east (more effective, cheaper): the new option dominates. Adopt it. There is no trade-off.
North-west (less effective, more expensive): the new option is dominated. Reject it.
North-east (more effective, more expensive): a trade-off. Is the extra health worth the extra cost? This is where the ICER and the threshold come in. Most new treatments fall here.
South-west (less effective, cheaper): also a trade-off. Is the money saved worth the health given up? This is rarer, but it matters when services are cut or scaled back.
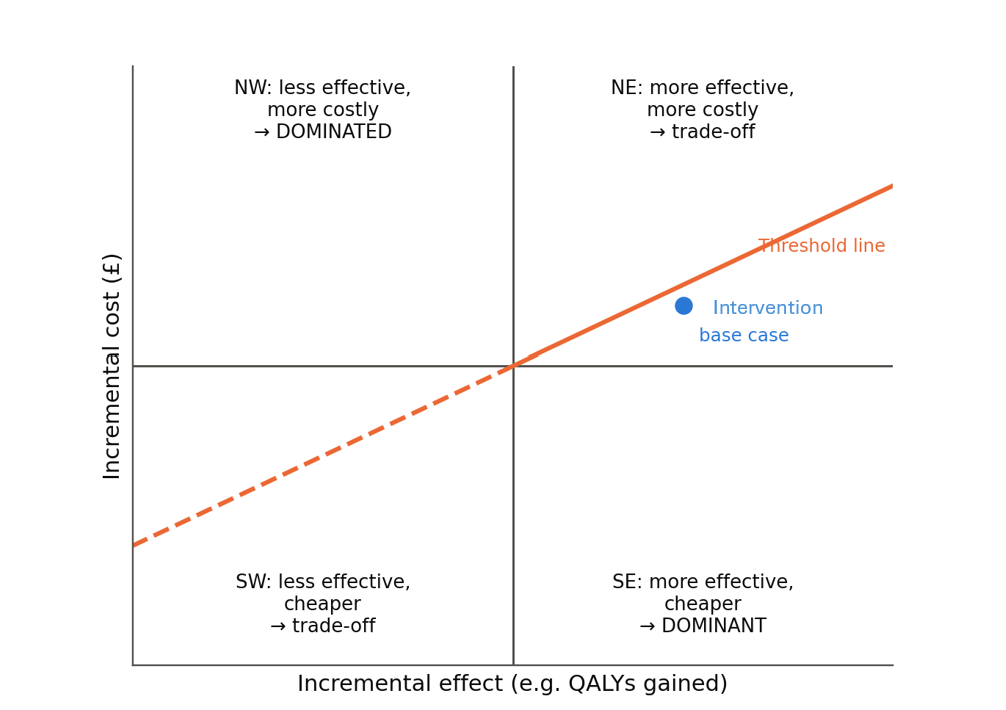
Figure 1.3. The cost-effectiveness plane. Results below the threshold line are regarded as good value. Intervention's base case falls in the north-east quarter, just below the line at £25,000 per QALY.
Net monetary benefit: an easier number to work with
ICERs have awkward properties. A negative ICER could mean the new option is better and cheaper, or worse and more expensive: you cannot tell from the number alone. And ratios behave badly when the difference in QALYs is close to zero.
An alternative is the net monetary benefit (NMB). You convert the QALY gain into money using the threshold, then subtract the extra cost:
NMB = (QALYs gained × threshold) − extra cost
If the NMB is positive, the new option is good value at that threshold. For an intervention if:
at £25,000 per QALY: (0.0544 × £25,000) − £1,214 = +£147 per patient;
at £35,000 per QALY: (0.0544 × £35,000) − £1,214 = +£691 per patient.
Both are positive, but at £25,000 the margin is thin: only about £147 per patient. A small change in any input could push it below zero. Chapter 2 explores exactly how fragile this result is.
Common mistakes in cost-effectiveness and cost-utility analysis Using average ratios instead of incremental ones. Always compare against the next best option. Comparing with the wrong option. Comparing a new service with "doing nothing" when the real alternative is an existing service makes almost anything look good. Hiding the QALY source. State where the quality of life weights come from. A model that assumes a large utility gain without direct evidence can produce almost any ICER. Reporting one ICER at one threshold. Report the net monetary benefit at more than one threshold, and show the uncertainty (Chapter 2). Using a time horizon that is too short or too long. Too short, and long-term benefits are missed. Too long, and the model rests on guesses about effects far beyond the evidence. |
Cost benefit analysis
The question
Is the total value of the benefits, in pounds, greater than the total costs?
How it is done
Cost-benefit analysis (CBA) puts everything into money, costs and benefits alike. The result is a net benefit (benefits minus costs) or a benefit-cost ratio (benefits divided by costs). A positive net benefit, or a ratio above 1, suggests the project is worth doing.
The hard part is turning health into money. There are three main approaches:
Willingness to pay. People are asked, directly or through structured choice experiments (known as discrete choice experiments), how much they would pay for a health improvement or a feature of a service.
Human capital. Health is valued by the extra production it allows: wages earned, days of work not lost.
A standard value per QALY. A fixed money value is applied to each QALY gained. HM Treasury's Green Book guidance for government appraisal uses a value of around £70,000 per QALY for this purpose. (Check the current edition for the exact figure and price year.)
Strengths and weaknesses
CBA's great strength is breadth. Because everything is in money, it can compare spending on health with spending on education, housing, transport or the environment. That is why HM Treasury's Green Book is built on it. It can also capture benefits outside health, such as carers returning to work.
Its weaknesses are just as real:
Putting a price on health is controversial. Many people are uneasy with the idea at all.
Willingness to pay depends on ability to pay. Richer people can afford to say they would pay more. Without adjustment, their health can appear "worth more".
Human capital ignores people outside paid work. Retired people, carers and children produce no wages, so their health can be valued at close to zero. For a COPD population, most of whom are over 65, this is a serious problem.
Survey results are sensitive to how questions are asked. Small changes in wording, order or the range of amounts offered can change the answers a great deal.
For these reasons NICE does not use CBA for its health technology assessments, and it is rare in NHS commissioning. It is more common in wider public policy appraisal and in the evaluation of programmes whose benefits go well beyond health.
Common mistakes in cost-benefit analysis Double counting. If a QALY value already includes the value of being able to work, adding productivity gains on top counts the same benefit twice. Mixing QALY values. Do not use a £70,000 QALY value in a CBA and then compare the result directly with a NICE threshold decision. They rest on different ideas of what a QALY is worth to the decision-maker. Hiding the monetisation. Always show the health benefits and their money value separately, so readers can apply their own value if they disagree. |
Budget impact analysis
The question
If we adopt this, what will happen to our spending over the next few years?
How it is done
A budget impact analysis (BIA) estimates the change in spending for a specific budget holder (an ICB, a trust, NHS England) if a new intervention is introduced. It compares two "worlds": the world with the new intervention and the world without it. The ISPOR good practice guidance on budget impact analysis (Sullivan and colleagues, 2014) sets out the standard approach. The key features are:
Perspective: the budget holder's own. Only costs that fall on that budget are counted.
Time horizon: short, usually one to five years, matching the budget cycle.
Population: the real, local eligible population, including how it changes over time as patients join, leave and die.
Uptake: a realistic estimate of how many eligible patients will use the new intervention each year. New services rarely reach full uptake immediately.
Costs: shown year by year, in cash terms, and not discounted. The finance director needs to know what will leave the account in each year.
Outcomes: included only as far as they change resource use, for example admissions avoided.
Common mistakes in budget impact analysis Using the BIA as evidence of value. A cheap intervention that does nothing will show a small budget impact. That does not make it good value. A BIA answers "can we afford it?", not "should we buy it?". Assuming 100% uptake from day one. This exaggerates both costs and savings in the early years and hides the real cash profile. Counting all avoided activity as cash. Show at least two cases: cash-releasing and non-cash-releasing. Forgetting that people die, move away or stop using the service. A static "cost × number of patients" calculation overstates long-run costs and savings. Discounting. Budget impact figures are normally shown undiscounted, in the prices of the year of the analysis, because they are meant to match what appears in the accounts. |
Choosing the right method
No method is best in all situations. The right choice depends on the question, the decision-maker, and the evidence available. In practice, a good evaluation usually combines several methods: for example, a cost-utility analysis to show value for money, a budget impact analysis to show affordability, and a cost-consequence table to show everything the QALY misses.
| If the decision-maker asks... | Start with... | And add... |
|---|---|---|
| "How big is this problem?" | Cost of illness | — |
| "What will it cost to run?" | Costing analysis | Budget impact analysis |
| "Can we afford it over the next three years?" | Budget impact analysis | Scenarios on uptake and cash release |
| "Will it pay for itself?" | Return on investment | Cost-utility analysis, because the answer is usually no, and that is not the end of the story |
| "What are all the effects?" | Cost-consequence analysis | — |
| "These two options do the same job. Which is cheaper?" | Cost-minimisation analysis, but only if equivalence is shown | A full analysis if equivalence is doubtful |
| "What does it cost per event prevented?" | Cost-effectiveness analysis | Cost-utility analysis, to compare across areas |
| "Is it good value for the NHS?" | Cost-utility analysis | Budget impact analysis, sensitivity analysis (Chapter 2) |
| "Is it good value for society as a whole, including non-health effects?" | Cost-benefit analysis | Cost-utility analysis for the health component |
Table 1.11. Matching the method to the question.
A useful rule of thumb: use the most complete method the evidence can support, and never let a partial or supporting analysis stand in for a question it cannot answer. A budget impact analysis cannot tell you whether something is good value. A positive ROI cannot tell you it is the best use of the money. A cost of illness figure cannot tell you that any intervention will reduce it.
Uncertainty quantification
Every health economic evaluation relies on input parameters derived from trial data, observational data, expert opinion, or published or secondary data. Because these inputs are subject to sampling variations, measurement errors, and methodological/structural choices, the models built from these data are inherently uncertain. For robust commissioning decisions, the economic evaluations should be able to quantify and communicate the uncertainty rather than rely solely on average values or ‘point estimates’.
Where the inputs come from, and why they are uncertain
Economic models draw their inputs from several kinds of source. Each brings its own kind of uncertainty.
| Source | Typical inputs | Main weaknesses |
|---|---|---|
| Randomised controlled trials | Treatment effects, quality of life, resource use | Small samples; short follow-up; trial patients and settings may not match real practice |
| Observational data (registries, hospital records, GP records) | Baseline event rates, costs, long-term outcomes | Confounding: differences between groups other than the treatment; missing or miscoded data |
| Published studies and meta-analyses | Utilities, mortality, costs | May not match the population or setting; varying quality; publication bias |
| National unit costs (PSSRU, National Cost Collection) | Unit costs | Averages that hide local variation; tariff may not equal true cost |
| Expert opinion | Anything with no data, such as future uptake or effect beyond the trial period | Optimism; anchoring on first estimates; vested interests; hard to check |
| Uncontrolled pilots and before-and-after studies | Early effect estimates for new services | Regression to the mean; selection of enthusiastic sites; no comparison group |
Types of uncertainty
The ISPOR and Society for Medical Decision Making (SMDM) modelling good practice task force (Briggs et al, 2012) set out a widely used way of classifying uncertainty.
| Type | Meaning | Main tool |
|---|---|---|
| Stochastic (first-order) uncertainty | Identical patients have different outcomes, by chance | Averaged out in cohort models; matters in patient-level simulation |
| Parameter (second-order) uncertainty | We do not know the true value of an input exactly | Deterministic and probabilistic sensitivity analysis |
| Heterogeneity | Real, explainable differences between groups of patients | Subgroup analysis |
| Structural uncertainty | Doubt about how the model is built | Scenario analysis; model averaging; turning the choice into a parameter |
Table 2.2. Types of uncertainty in economic evaluation.
A common mistake is to treat all uncertainty as parameter uncertainty and put it into a probabilistic sensitivity analysis. This gives a false impression of completeness. A PSA can only show uncertainty within the model as built. It says nothing about whether the model was built correctly.
What to report
A good report of uncertainty includes:
the base-case result (deterministic and probabilistic), with the net monetary benefit at more than one threshold;
a tornado diagram or table, showing which inputs matter most;
a threshold analysis for the key inputs, in plain language ("it remains good value as long as...");
the cost-effectiveness scatter plot and CEAC, with the probability of being cost-effective at the relevant thresholds;
scenario analyses for structural and methodological choices, with a clear statement of which the analyst considers most plausible and why;
subgroup results where there is a good reason to expect differences;
an honest, plain list of what the model does not capture.
Common mistakes in communicating uncertainty Hiding it. A single ICER in the executive summary, with uncertainty buried in an appendix, is the most common failing. Drowning the reader. Twenty tornado diagrams and a hundred scenarios are as unhelpful as none. Pick the results that bear on the decision. Using jargon. "The ICER is £22,305 per QALY with a 54% probability of cost-effectiveness at a WTP of £25,000" is accurate and nearly useless to a non-specialist board. Translate it. False precision. Reporting "£22,304.85 per QALY" suggests a level of accuracy the model does not have. Round sensibly. |
|---|
Sources:
Drummond MF, Sculpher MJ, Claxton K, Stoddart GL, Torrance GW. Methods for the Economic Evaluation of Health Care Programmes. 4th ed. Oxford University Press; 2015.
National Institute for Health and Care Excellence. NICE health technology evaluations: the manual (PMG36). Check for the latest update.
National Institute for Health and Care Excellence. Evidence standards framework for digital health technologies (ECD7). 2022 update.
Sullivan SD, Mauskopf JA, Augustovski F, et al. Budget impact analysis: principles of good practice. Report of the ISPOR 2012 Budget Impact Analysis Good Practice II Task Force. Value in Health. 2014;17(1):5–14.
Briggs AH, O'Brien BJ. The death of cost-minimization analysis? Health Economics. 2001;10(2):179–184.
Henderson C, Knapp M, Fernández JL, et al. Cost effectiveness of telehealth for patients with long term conditions (Whole Systems Demonstrator telehealth questionnaire study): nested economic evaluation in a pragmatic, cluster randomised controlled trial. BMJ. 2013;346:f1035.
McLean S, Hoogendoorn M, Hoogenveen RT, et al. Projecting the COPD population and costs in England and Scotland: 2011 to 2030. Scientific Reports. 2016;6:31893.
Masters R, Anwar E, Collins B, Cookson R, Capewell S. Return on investment of public health interventions: a systematic review. Journal of Epidemiology and Community Health. 2017;71(8):827–834.
Claxton K, Martin S, Soares M, et al. Methods for the estimation of the National Institute for Health and Care Excellence cost-effectiveness threshold. Health Technology Assessment. 2015;19(14).
HM Treasury. The Green Book: Central Government Guidance on Appraisal and Evaluation. Current edition, with supplementary guidance on wellbeing and health.
Husereau D, Drummond M, Augustovski F, et al. Consolidated Health Economic Evaluation Reporting Standards 2022 (CHEERS 2022) statement. Value in Health. 2022;25(1):3–9.