Module 1 - Counts vs Rates
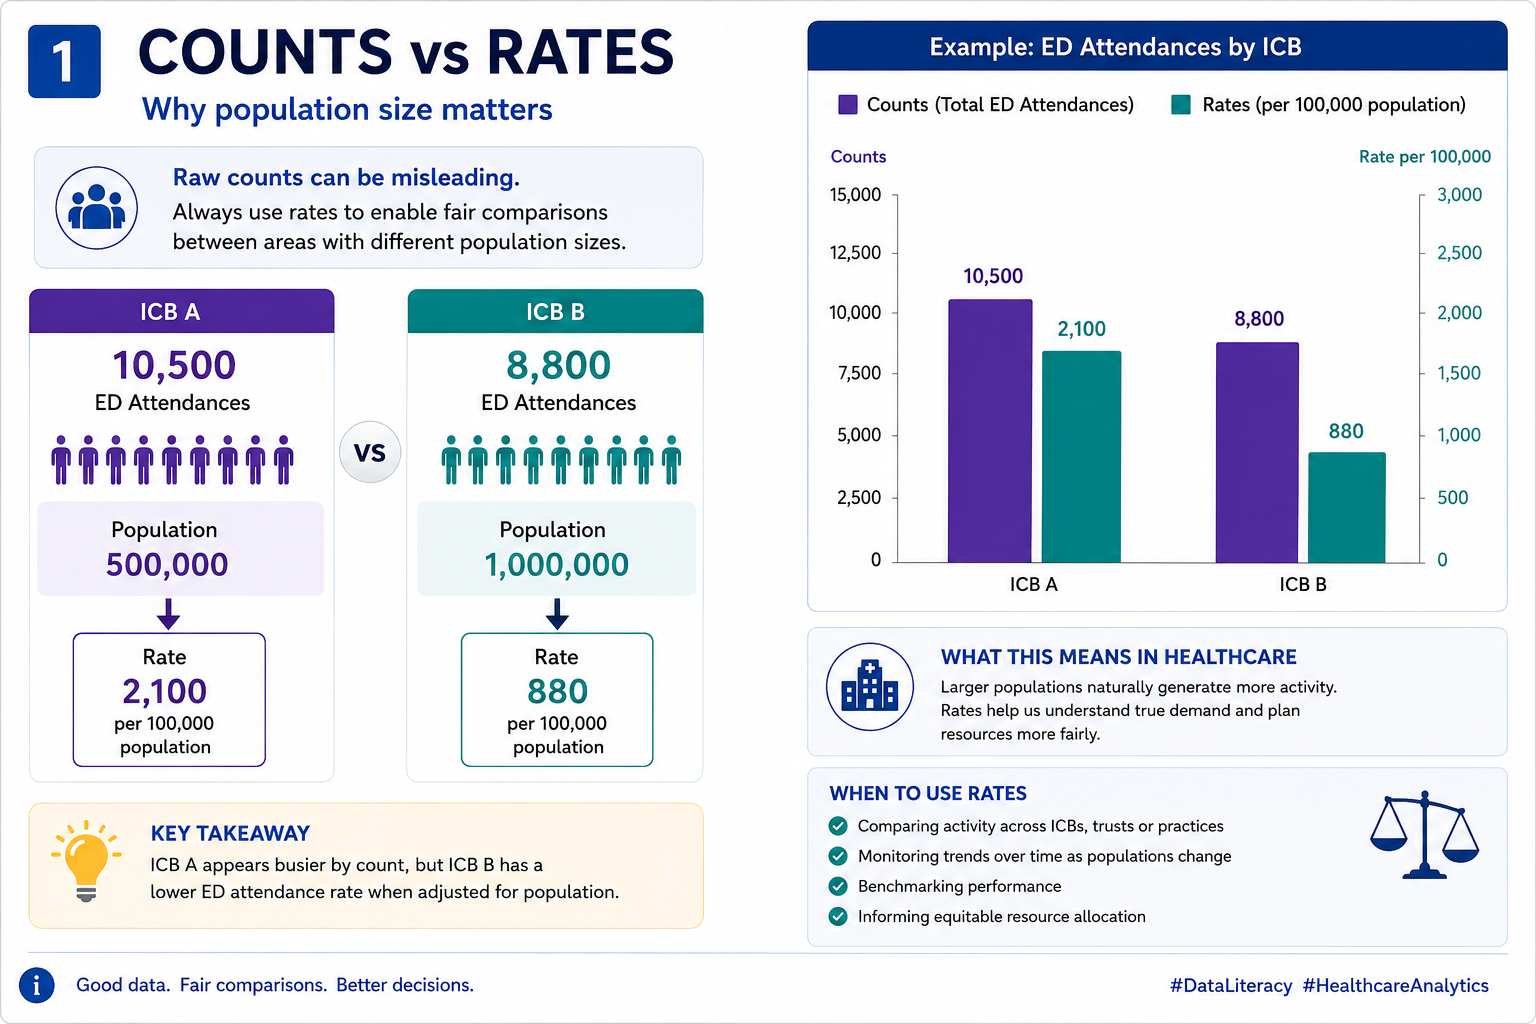
Imagine two Integrated Care Boards.
ICB A records:
80,000 emergency department attendances
ICB B records:
120,000 emergency department attendances
At first glance:
ICB B appears to have greater demand.
But what if ICB B serves a population twice as large?
Suddenly the interpretation changes.
This is why healthcare analytics rarely relies on counts alone.
To compare populations fairly, we often use:
rates
When Crude Rates Are Still Not Enough
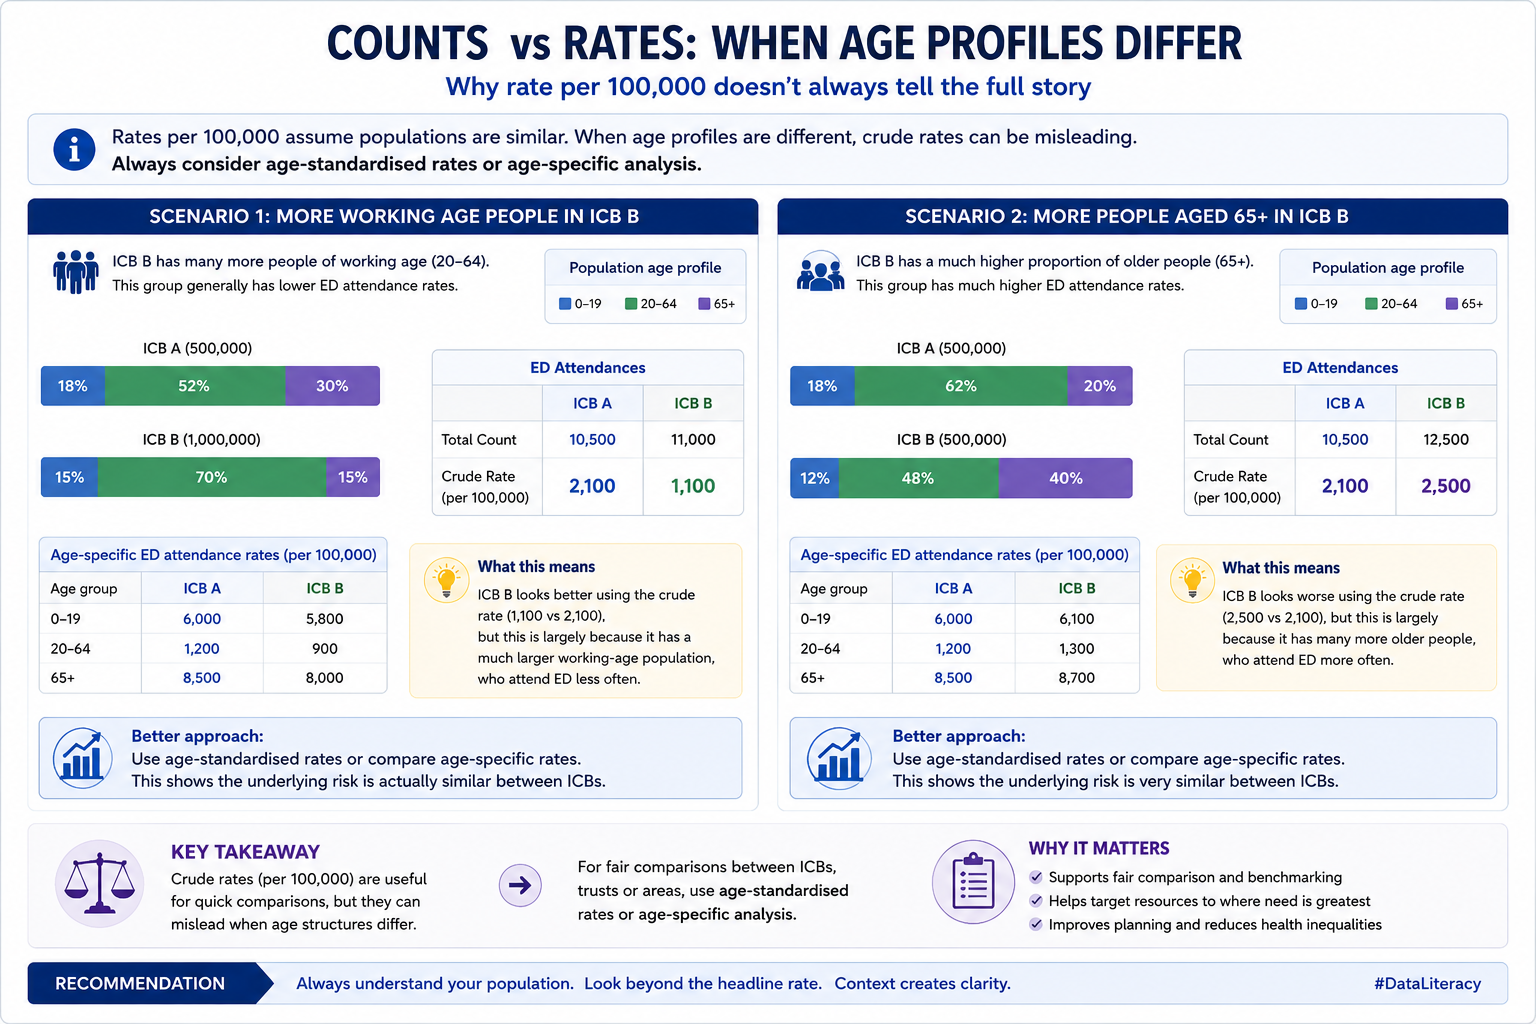
Even crude rates can mislead because populations may have very different age structures.
For example:
- one system may have a younger working-age population
- another may have substantially more older adults
Since healthcare use often increases with age:
crude rates alone may still produce unfair comparisons
When Should We Use Age-Standardised Rates?
The choice depends on the question you are trying to answer.
For healthcare analytics, the distinction is important because age-standardisation is fundamentally about removing differences in population structure so comparisons are fair.
| If your question is… | Use… |
|---|---|
| Fair comparison between systems | Age-standardised rates |
| Understanding real operational demand | Age-specific rates |
| Benchmarking inequalities | Age-standardised rates |
| Capacity planning | Actual population cohorts |
| Frailty planning | Age-specific demand |
For many NHS operational decisions:
crude and age-specific rates remain highly useful
Example 1
Imagine:
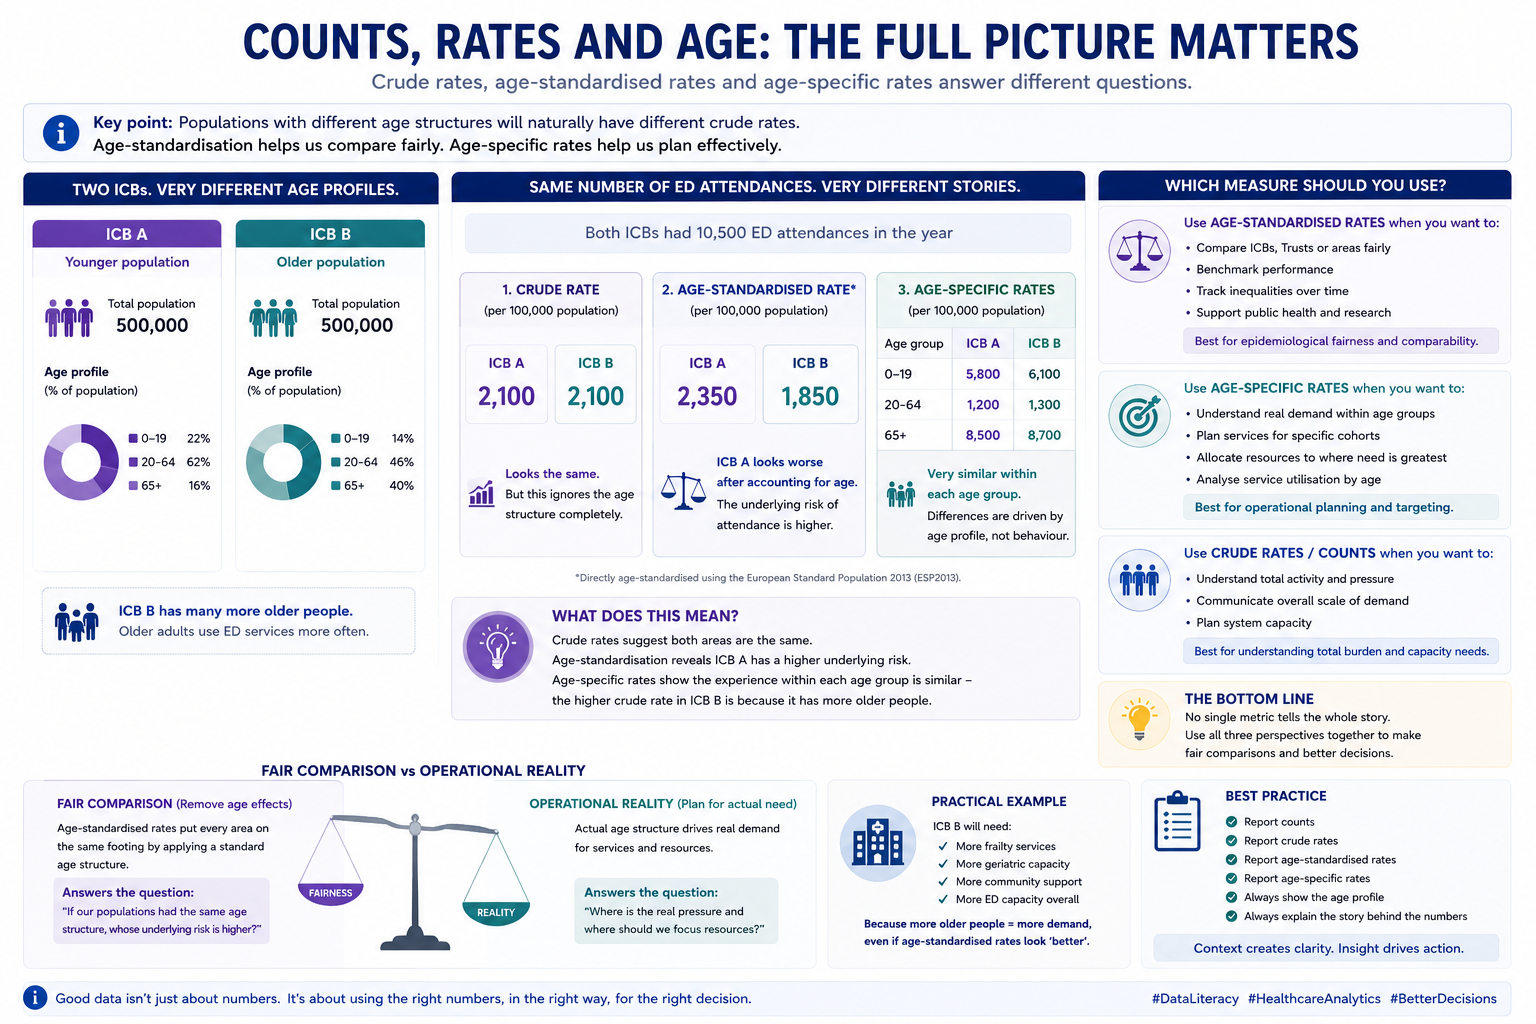
- ICB A — younger urban population
- ICB B — older rural/coastal population
Emergency department (ED) crude rates may naturally be higher in ICB B because healthcare utilisation often increases with age and frailty.
Age-standardisation removes this structural population difference.
This is useful if asking:
“Is the underlying utilisation risk genuinely higher?”
However, it may be less useful if asking:
“Which system actually needs more ED capacity?”
Why?
Because the older population — and its associated demand — still exists operationally.
A Note on Specific Age Cohorts
If analysis is already restricted to a defined cohort such as:
- 65+
- 0–19
- working-age adults
- frailty populations
then age-standardisation may add less value because age has already been partially controlled through cohort selection.
In these situations:
age-specific rates are often more meaningful and operationally interpretable
Example 2:
| Cohort | ED Attendances per 100k |
|---|---|
| 0–19 | 5,800 |
| 20–64 | 1,200 |
| 65+ | 8,700 |
Age-specific rates are often:
- easier to interpret
- operationally meaningful
- clinically intuitive
Practical NHS Guidance
| If the goal is… | Use… |
|---|---|
| Public health comparison | Age-standardised rates |
| Benchmarking organisations | Age-standardised rates |
| Research/publication | Age-standardised rates |
| Capacity planning | Actual population cohorts |
| Frailty planning | Age-specific rates |
| Understanding service pressure | Actual demand profiles |
When Should We Use Actual Population Cohorts?
When the goal is to understand:
real operational demand rather than fair comparison
actual population cohorts or age-specific rates are often more useful than age-standardised rates.
Examples include:
| Purpose | Example questions |
|---|---|
| Operational analytics | How much ED capacity is needed? Which age groups drive demand? What workforce or service capacity is required? |
| Population health management | Which populations carry the greatest burden? Where should interventions be targeted? |
| Service utilisation analysis | Who is using services most? Which patient groups are driving pressure or unmet need? |
Common operational use cases include:
- capacity planning
- demand modelling
- workforce planning
- frailty services
- community services
- targeted prevention and intervention design
A Practical Caveat
Age-standardised rates can sometimes obscure operational burden.
A system with an older, frailer population may appear statistically “average” after standardisation while still facing substantially greater service pressure.
This is why leaders should usually review:
- counts
- crude rates
- age-standardised rates
- age-specific breakdowns
together.
A Simple Rule of Thumb
For:
fair comparison
use:
age-standardised rates
For:
operational decision-making
use:
age-specific demand profiles
Questions Decision-Makers Should Ask
When reviewing healthcare activity counts or rates:
- Are we comparing populations of similar size?
- Would a rate provide a fairer comparison?
- Do age profiles differ?
- Would age-standardisation change interpretation?
- What does this metric represent operationally?
- Which patient groups are driving demand?
- What additional context is needed before acting?
A Final Caution
Rates improve fairness.
But they do not remove every structural difference between systems.
Two areas may have similar rates while facing very different levels of:
- frailty
- deprivation
- service availability
- pathway maturity
- community capacity
This means:
fair comparison does not automatically imply fair operational expectations
For example:
two systems with similar ED attendance rates may have very different opportunities for reduction depending on population need and local service configuration.
We explore this idea further in:
Module 5 — Standardisation & Fair Comparison