Module 13: Data Quality, Assurance & Trustworthy Data
Learning Objectives
By the end of this module you should be able to:
- understand why data quality is fundamental to trustworthy healthcare evidence
- recognise the main dimensions of data quality
- understand why data quality should always be considered in relation to fitness for purpose
- recognise why understanding the healthcare pathway is important when assessing data quality and appropriateness
- understand how definitions, coding and data collection processes can affect interpretation
- distinguish between patients, hospital spells, consultant episodes and ward stays
- understand how attribution decisions can change analytical conclusions
- understand the role of data lineage, metadata, master data management and data assurance in supporting trustworthy information
- recognise different levels of organisational data maturity
- ask better questions before using data to support healthcare decisions
Why This Matters
Healthcare organisations increasingly rely on data to:
- monitor performance
- understand population health
- plan services
- evaluate interventions
- allocate resources
- identify inequalities
- develop predictive models
- support artificial intelligence
But every analysis, dashboard and model depends on the quality and appropriateness of the data beneath it.
Before asking:
“What does the data tell us?”
we should first ask:
“Can we trust the data enough for the decision we are trying to make?”
This does not mean that healthcare organisations should wait for perfect data.
Perfect data rarely exists.
Instead, decision-makers need to understand:
- where the data came from
- how it was collected
- what it actually represents
- what may be missing
- what limitations exist
- whether those limitations materially affect the decision
Data does not need to be perfect to be useful.
But its quality, limitations and fitness for purpose should be understood before important decisions are made from it.
The more important the decision, the greater the need to understand and assure the evidence supporting it.
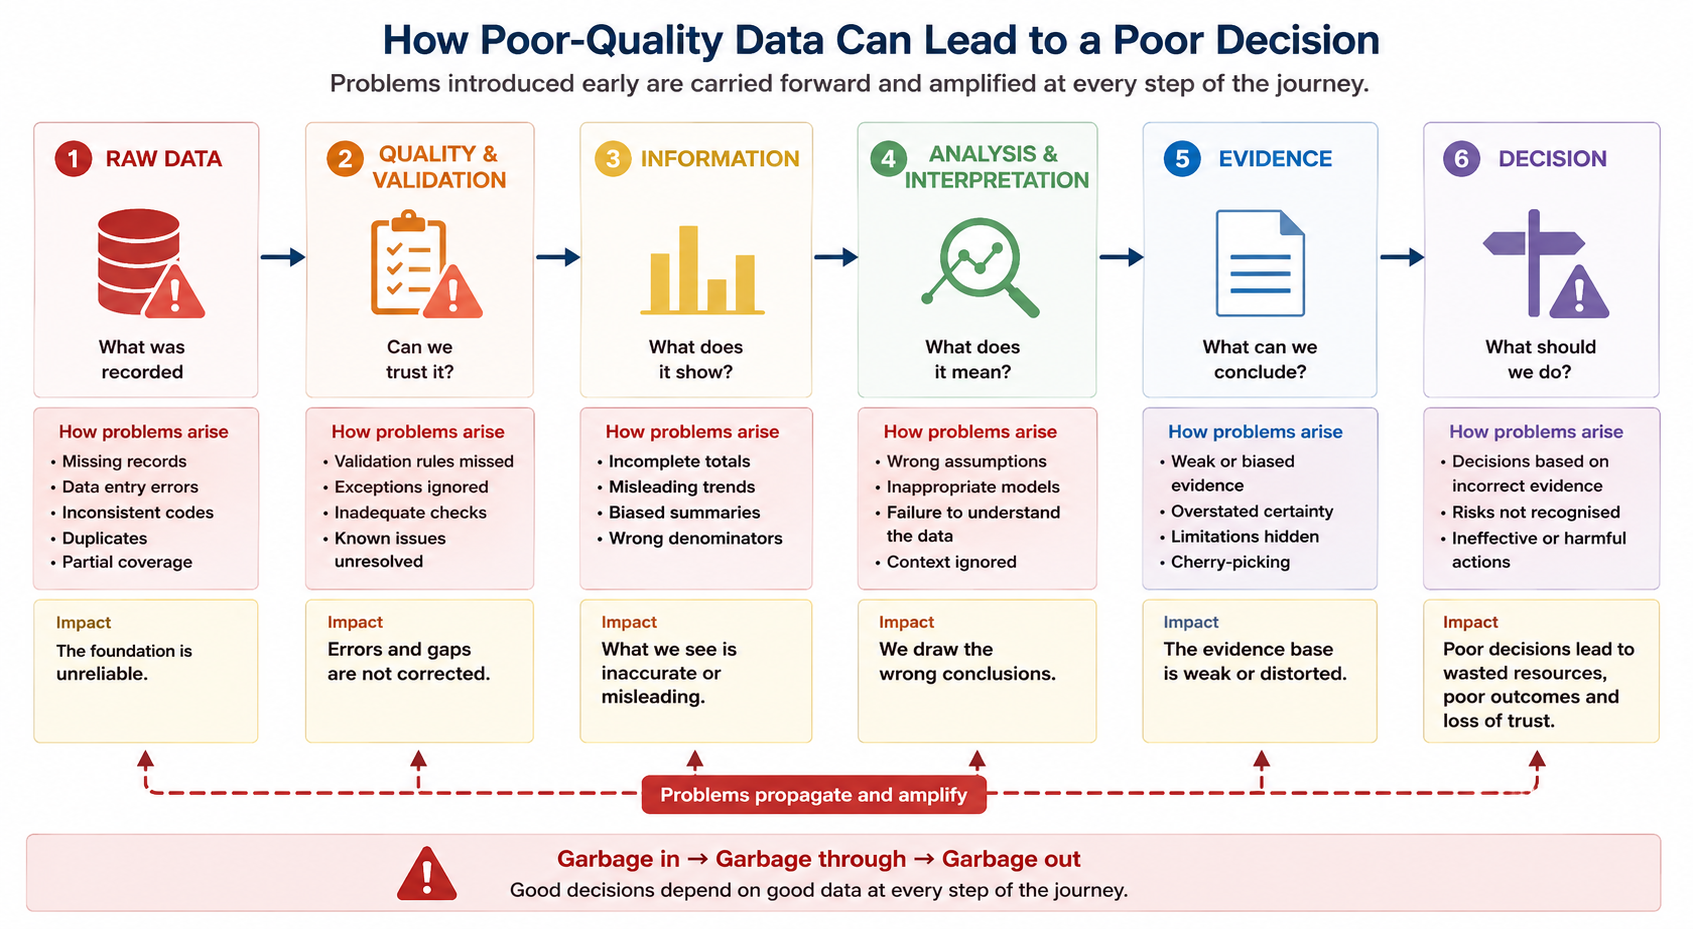
From Data to Evidence
Data alone is not evidence.
Data must first be collected, checked, processed, analysed, interpreted and placed into context before it can reliably support decision-making.
| Raw Data | → | Quality & Validation | → | Information | → | Analysis & Interpretation | → | Evidence | → | Decision |
|---|---|---|---|---|---|---|---|---|---|---|
| What was recorded | Can we trust it? | What does it show? | What does it mean? | What can we conclude? | What should we do? |
Problems introduced early in this journey can influence everything that follows.
A sophisticated statistical model cannot compensate for fundamentally unreliable data.
Similarly, a beautifully designed dashboard may create false confidence if the underlying data are incomplete, poorly defined or misunderstood.
When looking at a dashboard, report or analysis, ask:
What would I need to know about the underlying data before I would be comfortable making an important decision from this?
Data Quality Is Multidimensional
Data quality is not a single characteristic.
A dataset can be complete but inaccurate.
It can be accurate but out of date.
It can be timely but inconsistent between organisations.
Drawing on established data management principles, including those described within the DAMA Data Management Body of Knowledge (DAMA-DMBOK), data quality can be considered across several dimensions.
| Data Quality Dimension | What Does It Mean? | Healthcare Example | Question to Ask |
|---|---|---|---|
| Accuracy | Data correctly represents the real-world event or characteristic it is intended to describe. | A patient’s recorded discharge date matches the date they actually left hospital. | Does the data correctly represent what actually happened? |
| Completeness | The required records and data fields are sufficiently populated. | One provider has not yet submitted all of its Emergency Department activity for the latest month. | Are important records, organisations or fields missing? |
| Consistency | Data is recorded and defined in the same way across systems, organisations and time. | Two providers use different definitions when recording the same type of activity. | Are we genuinely comparing like with like? |
| Timeliness | Data is available sufficiently quickly for the purpose for which it is being used. | Recent activity data is incomplete because of delays between care being delivered and data being submitted. | Is the data current enough for the decision being made? |
| Validity | Data conforms to agreed formats, definitions, rules and allowable values. | A discharge date occurs before the patient’s admission date, indicating an invalid sequence. | Does the data conform to expected rules and definitions? |
| Uniqueness | Each real-world entity or event is represented only once when it should be. | The same patient attendance appears twice because duplicate records have been created. | Could duplicate records be affecting the results? |
| Integrity | Relationships between data elements and datasets remain accurate and coherent. | A hospital episode cannot be correctly linked to the patient’s wider hospital spell. | Do related records and datasets connect as expected? |
These dimensions are interconnected.
Improving one dimension does not automatically resolve problems in another.
For example, a dataset may be 100% complete but still contain inaccurate information.
Similarly, highly accurate data may arrive too late to support an operational decision.
No single data quality dimension determines whether data can be trusted.
The important question is whether the combination of accuracy, completeness, consistency, timeliness, validity, uniqueness and integrity makes the data sufficiently reliable for the question being asked and the decision being made.
Fitness for Purpose
Perhaps the most important principle in data quality is fitness for purpose.
The question is not simply:
“Is this good-quality data?”
The better question is:
“Is this data good enough for the purpose for which we intend to use it?”
The same dataset may be appropriate for one purpose and unsuitable for another.
For example, provisional monthly activity data may be perfectly adequate for identifying an emerging operational trend.
The same data may be unsuitable for:
- determining contractual payments
- evaluating the effectiveness of an intervention
- comparing organisations publicly
- training a clinical prediction model
The required level of data quality therefore depends partly on the consequences of the decision.
Data quality should always be considered in context.
A dataset does not need to be perfect.
It needs to be sufficiently reliable for the question being asked and the decision being made.
Understanding the Pathway Behind the Data
Assessing data quality is not simply a technical exercise.
To understand whether data is reliable and appropriate for a particular purpose, analysts and decision-makers often need to understand the healthcare pathway and operational processes that generate it.
A dataset may be technically complete and internally consistent while still providing an incomplete or misleading representation of what is happening in practice.
For example, understanding elective waiting list data requires knowledge of:
- how patients enter the pathway
- when an RTT clock starts
- when and why clocks may stop
- how patients transfer between services or providers
- where activity is recorded
- how changes in operational processes affect the data
Similarly, interpreting delayed discharge data requires an understanding of how discharge readiness is identified, recorded and updated across the patient pathway.
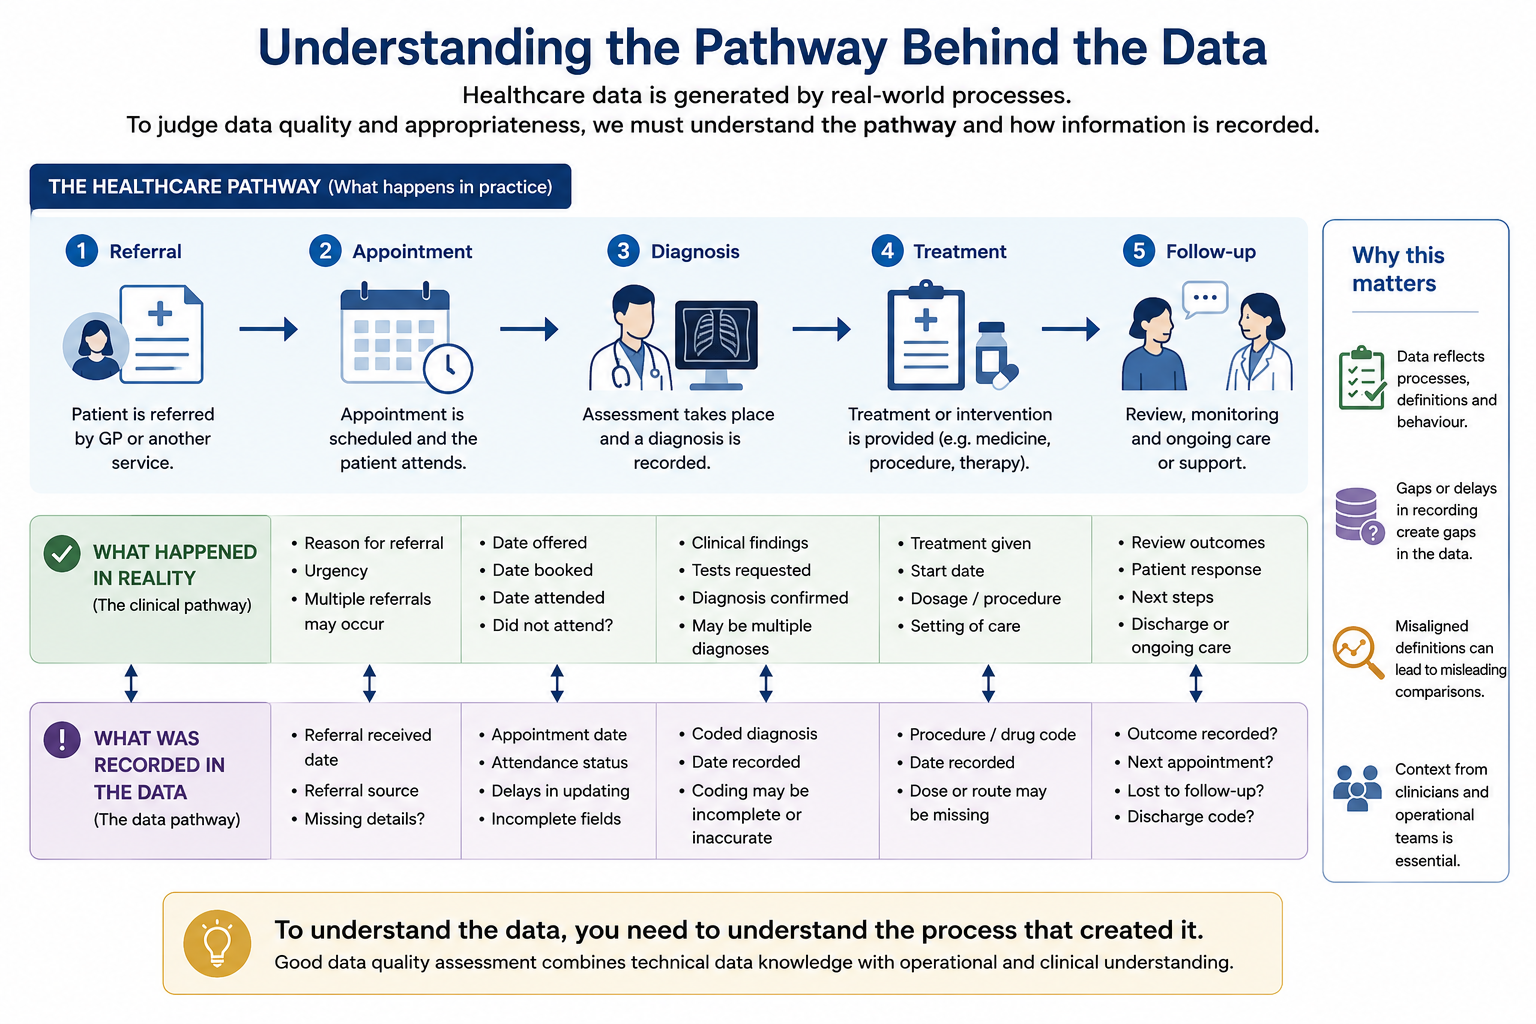
You cannot always assess the quality or appropriateness of data by examining the dataset alone.
Understanding how healthcare is delivered, how patients move through the pathway and how information is recorded along the way is often essential to determining whether the data is fit for purpose.
Good data quality assessment therefore combines technical data knowledge with operational and clinical understanding.
A Practical Data Quality Checklist
Before using a dataset, dashboard or analysis to support an important decision, consider the following questions.
1. Source
- Where did the data come from?
- Who collected it?
- Why was it originally collected?
- Is it primary data or derived from another source?
- Has it passed through multiple systems before reaching the analysis?
2. Coverage
- Does the data cover the population we are interested in?
- Are any organisations, services or patient groups missing?
- Has coverage changed over time?
- Could some groups be systematically under-represented?
3. Completeness
- Are important records missing?
- Are important variables incomplete?
- Is missingness concentrated within particular organisations or groups?
- Could missing data bias the conclusions?
4. Accuracy
- Are values plausible?
- Have unusual values been investigated?
- Have records been validated against another source where appropriate?
- Could data entry or coding errors affect the results?
5. Consistency
- Are definitions consistent across organisations?
- Are fields coded in the same way?
- Have definitions changed over time?
- Are we genuinely comparing like with like?
6. Timeliness
- How recent is the data?
- Is there a delay between an event occurring and appearing in the dataset?
- Are recent periods less complete because submissions are still arriving?
7. Fitness for Purpose
- What decision are we trying to make?
- What level of confidence does that decision require?
- Could known data limitations materially change the decision?
Missing data is not always distributed randomly.
If particular populations, services or geographical areas are systematically less well represented, the resulting analysis may provide an incomplete picture of need or outcomes.
A dataset can therefore appear broadly complete while still being less reliable for particular groups.
When assessing completeness, ask not only:
“How much data is missing?”
but also:
“Whose data is missing — and could that change our conclusions?”
⭐ Worked Example: When Falling Activity Does Not Mean Falling Demand
Imagine a healthcare dashboard showing that Emergency Department attendances have fallen sharply during the latest month.
At first glance, this appears to be good news.
A decision-maker might conclude that:
Demand for emergency care is falling.
However, further investigation reveals that one provider has not yet submitted its complete activity data.
The apparent reduction is therefore not a genuine change in demand.
It is a data completeness problem.
Once the missing records are submitted, activity returns to its expected level.
Before explaining an unexpected change in performance, first check whether the change could have been caused by the data itself.
Sudden changes may reflect:
- incomplete submissions
- changes in coding
- changes in definitions
- system migrations
- reporting delays
- changes in data collection processes
Not every change in a chart represents a change in the healthcare system.
Data Quality Can Change Over Time
A dataset that was reliable last year may not be directly comparable with data collected today.
Changes can occur because of:
- new information systems
- revised national definitions
- changes in clinical coding
- organisational mergers
- changes in reporting requirements
- new data suppliers
- changes in operational practice
This creates an important distinction between:
A real change in the healthcare system
and
A change in how the healthcare system is recorded
Analysts and decision-makers need to understand both.
Understanding What Is Being Counted
Healthcare data can describe the same patient journey at several different levels.
Terms such as patient, hospital spell, consultant episode and ward stay are sometimes used interchangeably in everyday conversation.
In healthcare data, however, they can represent different things.
Consider a simplified patient journey.
A patient is admitted to hospital and remains there for 14 days.
During that admission, the patient:
- is admitted under Acute Medicine
- transfers to Cardiology
- later moves to a Rehabilitation ward
- is discharged home
This represents one patient journey, but the underlying data may contain several different units of activity.
| Unit | What It Represents |
|---|---|
| Patient | The individual receiving care. The same patient may have multiple admissions over time. |
| Hospital Provider Spell | The continuous period from admission to discharge under the care of a hospital provider. |
| Consultant Episode | A period during which a patient is under the care of a particular consultant or clinical specialty within the wider hospital spell. |
| Ward Stay | A period during which the patient occupies or is associated with a particular ward or location. |
Note: The above is a simplified explanation of a Hospital Providee Spell. NHS data definitions include more detailed distinctions between episodes, hospital provider spells and continuous inpatient spells.
The diagram below illustrates how a single patient journey can generate several different units of healthcare activity.
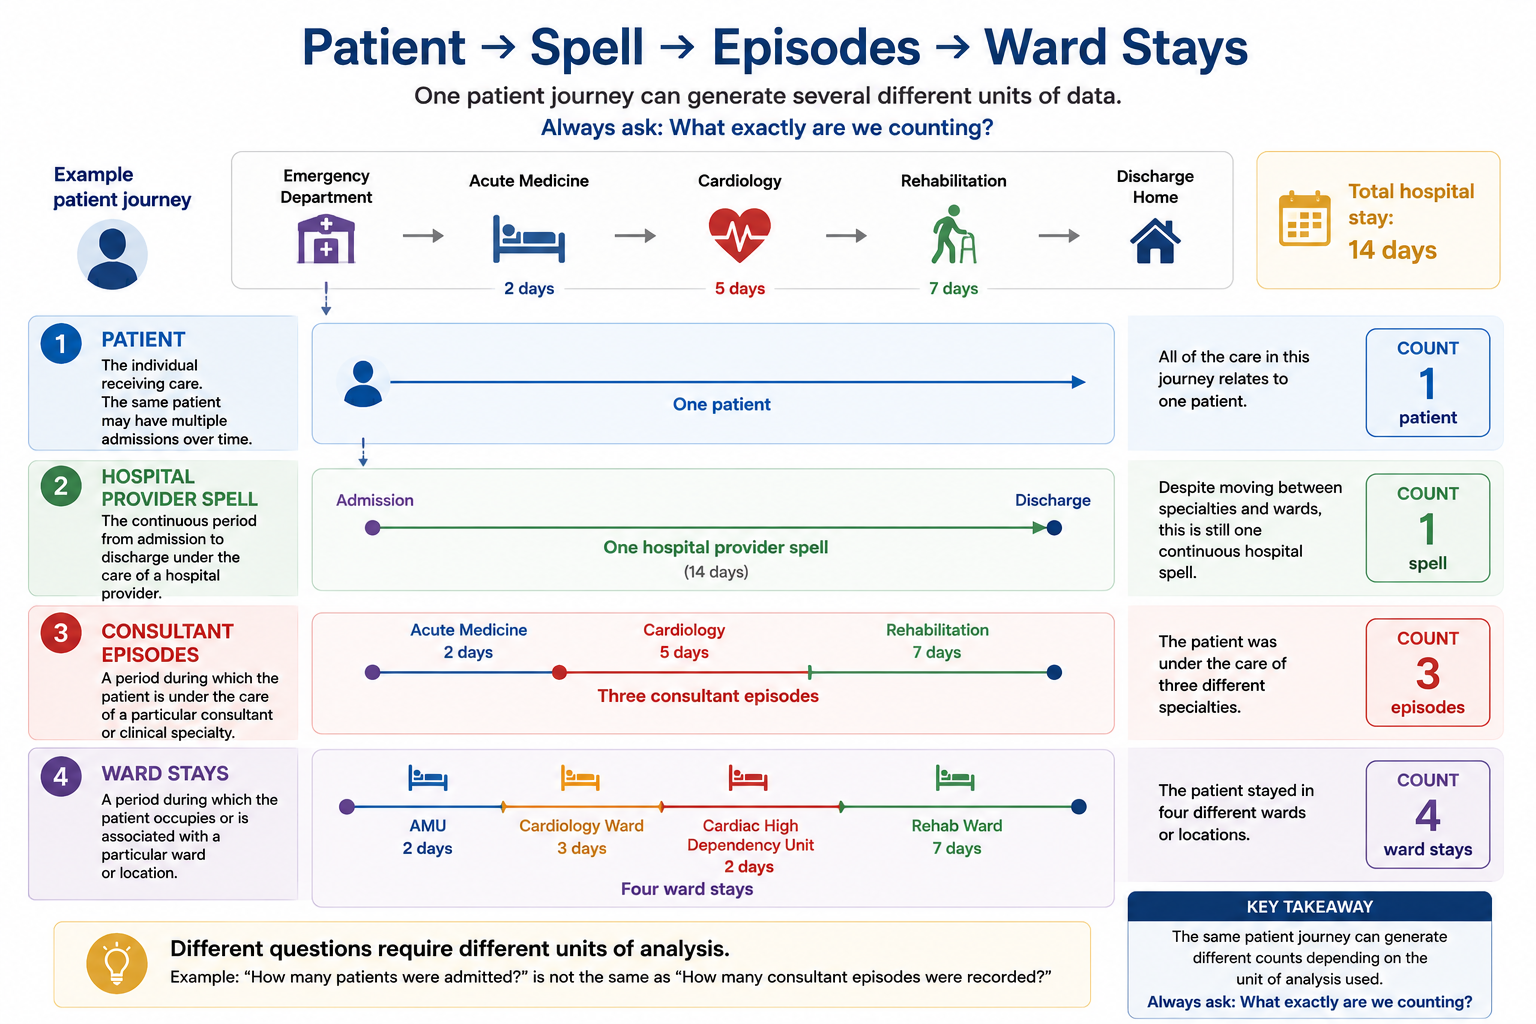
A single hospital spell may therefore contain:
- one patient
- one hospital provider spell
- multiple consultant episodes
- multiple ward stays
This distinction matters because different analytical questions require different units of analysis.
For example:
How many patients were admitted?
is not necessarily the same question as:
How many consultant episodes were recorded?
Similarly, counting ward stays may produce a different number again if patients move between wards during the same admission.
Before interpreting a healthcare metric, understand its unit of analysis.
Is the number counting:
- patients?
- attendances?
- admissions?
- hospital spells?
- consultant episodes?
- ward stays?
- procedures?
- bed days?
Different units can produce very different numbers while describing the same underlying healthcare activity.
Why This Matters for Attribution
Once a patient moves between wards, specialties or consultants, another question arises:
Who should the patient’s activity or outcome be attributed to?
Should a 14-day hospital stay be attributed to:
- the specialty that admitted the patient?
- the specialty that discharged the patient?
- the service responsible for most of their care?
- each consultant episode separately?
- each ward according to the time spent there?
There may not always be one universally correct answer.
The appropriate approach depends on the question being asked.
What matters is that the definition and attribution method are understood, applied consistently and clearly communicated.
This leads to another important data literacy principle:
The same patient journey can produce different analytical answers depending on what is counted and how it is attributed.
Clinical Coding and Healthcare Data
Much healthcare analysis relies on information created through clinical coding and standardised clinical terminology.
Examples include:
- ICD codes for diagnoses and health conditions
- OPCS codes for procedures and interventions
- SNOMED CT for clinical terminology used within electronic health records
These coding systems allow healthcare activity and clinical information to be classified and analysed consistently.
However, coding quality can vary.
Apparent differences between organisations may sometimes reflect:
- different coding practices
- differences in clinical documentation
- coding completeness
- changes in coding guidance
- differences in case mix
This does not mean coded data cannot be trusted.
It means that analysts should understand how coding practices may influence interpretation.
Attribution Matters
Healthcare activity often needs to be attributed to an organisation, specialty, service or location.
But attribution is not always straightforward.
Consider a patient who:
- enters hospital through the Emergency Department
- is admitted to an acute medical ward
- transfers to Cardiology
- later moves to a Rehabilitation ward
- is discharged home
Which part of the organisation should the outcome be attributed to?
The answer may depend on whether the analysis uses:
- admission ward
- discharge ward
- responsible specialty
- consultant episode
- hospital site
- provider organisation
Different attribution rules can produce different results from the same underlying patient journey.
Before comparing teams, services or organisations, understand how activity and outcomes have been attributed.
A change in attribution methodology can create an apparent change in performance even when the underlying care has not changed.
⭐ Worked Example: How Attribution Can Change the Story
Imagine an NHS organisation is reviewing the average length of stay for patients treated by different specialties.
A patient is admitted under Acute Medicine, later transfers to Cardiology, and eventually moves to a Rehabilitation ward before discharge.
The organisation wants to understand which specialty should be associated with the patient’s overall hospital stay.
At first glance, this may seem straightforward.
However, there are several possible approaches.
The patient’s stay could be attributed to:
- the admitting specialty
- the discharging specialty
- the specialty responsible for the longest period of care
- individual consultant episodes
- the ward where the patient spent most of their time
Each approach answers a slightly different question.
For example, consider the following patient journey:
| Emergency Department | → | Acute Medicine | → | Cardiology | → | Rehabilitation | → | Discharge |
|---|---|---|---|---|---|---|---|---|
| Entry | 2 days | 5 days | 7 days | Exit |
Total hospital stay: 14 days
But which service should those 14 days be attributed to?
If the analysis uses the admitting specialty, the entire stay might appear under Acute Medicine.
If it uses the discharging specialty, it might appear under Rehabilitation.
If the analysis considers individual episodes or ward stays, the activity may instead be distributed across several parts of the organisation.
All of these approaches use the same underlying patient journey, but they can produce very different pictures of performance.
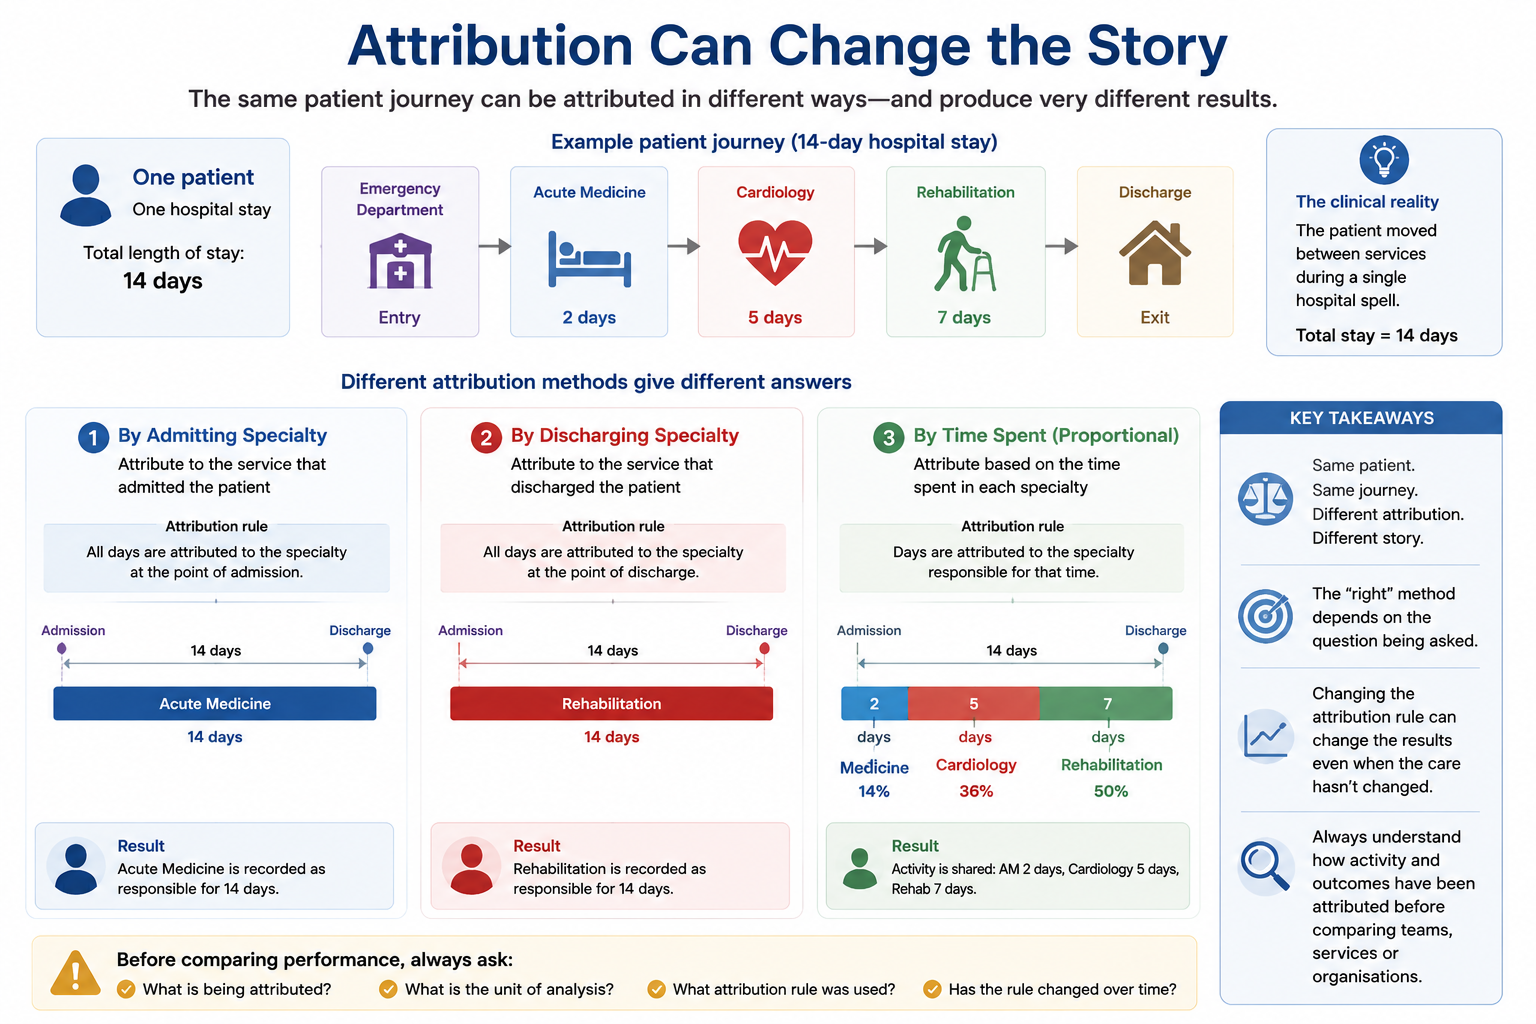
Two analysts can use the same underlying data and produce different results without either analysis necessarily being wrong.
The difference may lie in the definition, unit of analysis or attribution rule being used.
Before comparing performance between specialties, wards, sites or organisations, decision-makers should understand exactly how patients, activity and outcomes have been attributed.
Why This Matters for Performance Comparisons
Suppose one hospital reports average length of stay by admitting specialty, while another attributes patients according to their discharging specialty.
A direct comparison may appear valid.
But the organisations may not actually be measuring the same thing.
Similarly, changes in attribution methodology over time can create apparent improvements or deterioration even when the underlying patient experience has not changed.
This is why analytical assurance should consider not only whether the numbers are technically correct, but whether the method used to produce them is appropriate and consistent.
When reviewing performance attributed to a service, specialty or organisation, ask:
- What exactly is being attributed?
- What is the unit of analysis: patient, spell, episode or ward stay?
- Is activity attributed to the starting or ending service?
- How are patients who move between specialties handled?
- Are the same attribution rules being used across organisations?
- Have the attribution rules changed over time?
- Would using a different attribution method materially change the conclusion?
Always understand who gets the number — and why before drawing conclusions from it.
Understanding Data Lineage
Healthcare data often passes through several systems and transformations before it reaches a dashboard, report or analytical model.
For example:
Clinical System → Data Warehouse → Data Transformation → Derived Metric → Dashboard
During this journey, data may be:
- cleaned
- recoded
- aggregated
- linked to other datasets
- filtered
- transformed into new measures
Understanding data lineage means understanding where data originated and how it has changed as it moved through these processes.
This becomes particularly important when an unexpected number appears in a report.
Is the problem:
- in the original source data?
- in how data was extracted?
- in a transformation rule?
- in how datasets were linked?
- in the calculation of the metric?
- in how the final result was presented?
When a number looks unexpected, do not only ask:
“Is this number correct?”
Also ask:
“Where did this number come from, and what happened to the data before it reached me?”
Understanding data lineage makes it easier to identify where errors have been introduced and who is best placed to investigate them.
Metadata: Data About Data
Metadata describes what data means.
Good metadata should explain:
- the definition of each field
- where the data originated
- how frequently it is updated
- who owns the data
- how values are calculated
- known limitations
- changes in definitions over time
Without good metadata, organisations may have large volumes of data but limited shared understanding of what that data actually represents.
A data dictionary is therefore an important part of trustworthy analytics.
Master Data Management
Healthcare organisations often hold information about the same entities across multiple systems.
These entities may include:
- patients
- clinicians
- organisations
- providers
- services
- locations
- specialties
The same entity may be represented differently in different systems.
For example, a cardiology service might appear as:
| System | Recorded Value |
|---|---|
| System A | Cardiology |
| System B | Cardiac Services |
| System C | CARD |
| System D | Specialty 320 |
A human looking at these values may recognise that they refer to the same or closely related concepts.
A computer system may not.
When information from multiple systems is combined, inconsistent naming, coding or identifiers can result in:
- duplicate records
- incomplete data linkage
- inconsistent reporting
- activity being attributed incorrectly
- different teams producing different answers to the same question
Master Data Management (MDM) is concerned with creating and maintaining consistent information about important entities used across an organisation.
Alongside appropriate reference data, this can help ensure that different systems and analytical processes use consistent definitions and identifiers.
Good master and reference data supports:
- consistent reporting
- reliable data linkage
- fewer duplicate records
- clearer organisational hierarchies
- consistent service definitions
- more trustworthy analytics
If different teams or systems use different definitions for the same organisation, service, specialty or population, they may produce different answers to what appears to be the same question.
Trustworthy analytics therefore depends not only on the quality of individual records, but also on a shared understanding of what those records represent.
Before combining data from different systems, ask:
Do these systems mean the same thing when they appear to be describing the same thing?
Matching labels does not always mean matching definitions.
Equally, different labels may sometimes represent the same underlying entity.
Data Assurance
In simple terms, data quality concerns the characteristics of the data; data assurance concerns the processes that give us confidence in the data, analysis and resulting information.
Data assurance asks a broader question:
What processes give us confidence that the information and analysis can be trusted?
Assurance is important because even good-quality data can be used incorrectly.
For example, an analysis may use accurate data but:
- apply an incorrect definition
- use an inappropriate denominator
- attribute activity to the wrong service
- compare populations that are fundamentally different
- contain an error in the analytical method
- fail to account for known limitations in the data
Data assurance therefore considers not only the underlying data, but also the processes through which data becomes information and evidence.
Assurance activities may include:
- automated validation rules
- reconciliation against source systems
- checking unusual values and trends
- peer review
- documented analytical methodology
- version control
- reproducible analytical processes
- audit trails
- clinical or operational sense-checking
- formal sign-off procedures
The appropriate level of assurance should reflect the importance and potential consequences of the decision.
A provisional operational dashboard used to identify emerging pressures may require a different level of assurance from:
- a statutory return
- a Board performance report
- a nationally published statistic
- a major financial investment decision
- an evaluation of a significant healthcare intervention
A Practical Data Assurance Checklist
Before relying on important analysis, ask:
Trustworthy information often requires collaboration between:
- analysts
- clinicians
- operational teams
- data engineers
- information governance teams
- clinical coders
- data owners
- data stewards
The people closest to the service or pathway often provide essential context that cannot be identified from the data alone.
A number can be technically valid while still failing to reflect what is happening operationally.
Understanding Data Maturity
Organisations vary considerably in how effectively they manage data.
Some organisations rely heavily on individual analysts to identify and correct data problems.
Others have established organisation-wide standards, clear ownership and processes for continuously monitoring and improving data quality.
The following is a simplified illustrative maturity model rather than a formal DAMA or NHS England maturity assessment framework.
| Maturity Level | Characteristics |
|---|---|
| 1. Initial | Data is fragmented, definitions vary and data quality problems are addressed reactively. Analysts may spend considerable time identifying and correcting problems manually. |
| 2. Developing | Some standards and data quality processes exist, but practices vary between teams, services or organisations. |
| 3. Defined | Common standards, definitions, ownership and governance arrangements are established and documented. |
| 4. Managed | Data quality is routinely measured, monitored and reported. Responsibilities for addressing problems are clear. |
| 5. Optimised | Data is treated as a strategic organisational asset. Quality is continuously improved, common standards are embedded and problems are increasingly prevented at source. |
Moving up the maturity curve requires more than investing in new technology.
It also requires:
- leadership
- clear accountability
- data ownership and stewardship
- agreed definitions and standards
- effective governance
- organisational culture
- data literacy
- continuous improvement
Ask:
Are our analysts repeatedly correcting the same data quality problems, or are we addressing the processes that create those problems in the first place?
Repeatedly cleaning the same data may solve an immediate analytical problem.
A more mature organisation asks why the problem occurred and how it can be prevented at source.
Persistent data quality problems are rarely solved by repeatedly cleaning datasets at the end of the process.
Sustainable improvement requires organisations to manage data throughout its lifecycle.
The goal is to move from:
“Analysts fixing bad data”
towards:
“Organisations managing data as an important asset.”
Data Quality and Artificial Intelligence
The quality and representativeness of data becomes even more important when data is used to develop artificial intelligence and machine learning models.
Data used to train AI models may also reflect historical patterns of healthcare access, recording and decision-making. A model can therefore learn patterns that are accurately represented in the data but do not necessarily represent equitable or desirable healthcare practice.
Poor-quality or unrepresentative data can result in:
- biased predictions
- unreliable risk scores
- unequal performance across population groups
- inappropriate recommendations
AI does not remove the need for good data management.
It increases it.
An advanced algorithm trained on poor-quality, biased or poorly understood data can produce highly sophisticated but unreliable results.
The more powerful the analytical method, the more important it becomes to understand the data on which it depends.
Questions Decision-Makers Should Ask
Before relying on data or analysis, ask:
- Where did this data come from?
- What transformations has the data undergone before reaching this analysis?
- Can we trace this metric back to its source?
- What healthcare process or pathway generated it?
- What exactly is being counted?
- Is the data complete?
- Are definitions consistent?
- Has anything changed in how the data is collected?
- Are we comparing like with like?
- How has activity been attributed?
- What important information might be missing?
- What quality assurance has been undertaken?
- Are known limitations clearly explained?
- Is the data fit for the decision we are trying to make?
- Who is accountable for the quality of this data?
- Would someone who understands the service recognise this picture as plausible?
Key Takeaways
- Data does not need to be perfect to be useful.
- Data quality is multidimensional.
- Fitness for purpose is more important than pursuing perfect data.
- Assessing data quality often requires understanding the healthcare pathway that generated the data.
- Changes in data can reflect changes in recording rather than changes in healthcare.
- Understanding what is being counted is fundamental to correct interpretation.
- Clinical coding and attribution rules can materially affect results.
- The same patient journey can produce different analytical answers depending on definitions and attribution.
- Metadata and master data management support consistent interpretation.
- Understanding data lineage helps identify how information has changed between its source and the final analytical output.
- Data assurance provides confidence in how information has been produced.
- Persistent data quality problems often reflect organisational maturity rather than isolated analytical issues.
- Trustworthy evidence begins with understanding the data beneath it.
The purpose of data quality is not to create perfect datasets.
It is to ensure that decision-makers understand how much confidence they can place in the evidence in front of them.
This requires more than examining the data itself.
It requires understanding where the data came from, the healthcare pathway that generated it, what is being counted, how it has been processed and whether it is appropriate for the decision being made.
Good healthcare decisions require data that is sufficiently understood, assured and fit for purpose.
Further Reading
- DAMA International — DAMA-DMBOK: Data Management Body of Knowledge
- NHS England — Data Quality Maturity Index
- NHS Data Model and Dictionary